Analysis of how the current Gulf conflict affects virgin polymer markets and the strategic role of recycling in supply chain resilience.
The current conflict centred on Strait of Hormuz has rapidly turned a geopolitical risk premium into a physical logistics premium: commercial vessel transits that historically averaged ~138 per day have collapsed to low single digits in monitored data, while ports and anchorages across the Arabian Gulf face congestion, electronic interference and elevated operational risk. The resulting disruption hits plastics twice—first through energy/feedstocks (crude, naphtha, LPG/ethane) and second through the cost and feasibility of moving polymers (insurance, freight, port access).
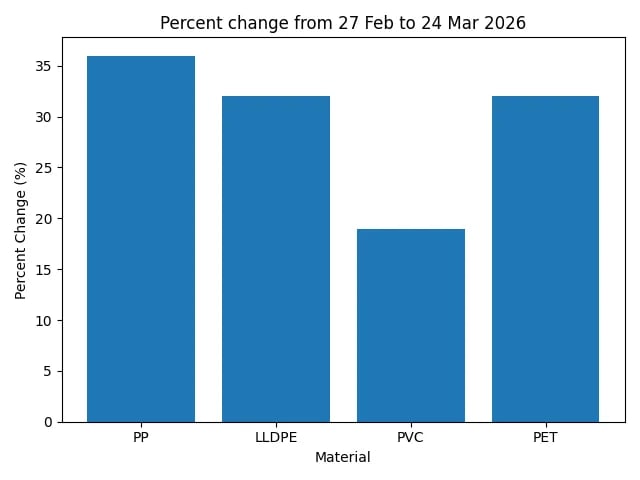
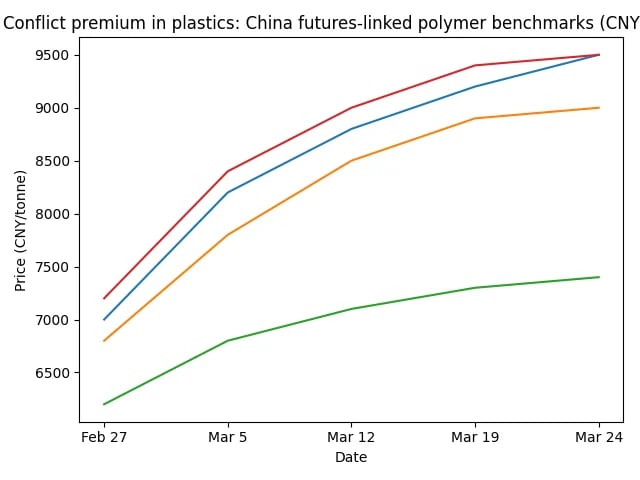
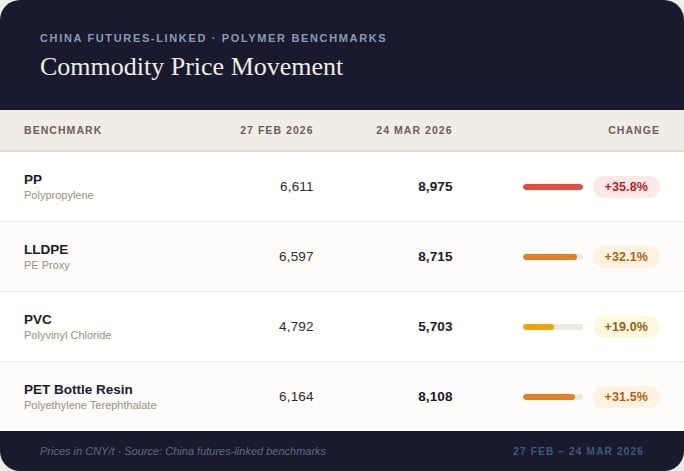
Market impact is already visible in pricing proxies and assessed markets. Futures-linked benchmarks for PP, PE (LLDPE proxy), PVC and bottle-grade PET resin in China rose sharply from the pre-escalation baseline (27 Feb) to late March (24 Mar), with PP up ~36%, LLDPE ~32%, PVC ~19% and PET bottle resin ~32% (CNY/tonne). In parallel, S&P Global reporting based on Platts assessments shows large spot gains in polypropylene across Asia, Europe and Africa in early March as Middle East offers thinned and feedstock/energy costs jumped.
On the supply side, the region's importance is structural: the Gulf zone hosts a significant share of global polyolefins capacity and exports, and a large share of those exports depend on a small number of vulnerable ports and the Hormuz transit corridor. For example, Argus Media cites data indicating the Middle East has >23 million t/y of polyethylene capacity (~15% of global capacity) and >10 million t/y polypropylene capacity (~9% of global). Port risk matters: Jebel Ali Port alone handles a majority share of GCC polymer exports per port operator statements reported by Argus.
Recycling can meaningfully reduce exposure—especially for converters with flexible specifications that can accommodate certified PCR blends—because it replaces imported virgin volumes with locally sourced material and lowers the fossil-feedstock link in procurement. Life-cycle evidence also supports the climate and energy case: recycled vs virgin pellets can deliver materially lower global warming potential (GWP) per kg, depending on resin and methodology. But recycling is not a "switch you flip": collection and sorting constraints, contamination (particularly PVC in PET streams), logistics inefficiency of baled feedstock, and unstable policy enforcement can choke supply exactly when demand for recyclate rises.
Below is a concise event timeline anchoring why plastics are affected quickly.
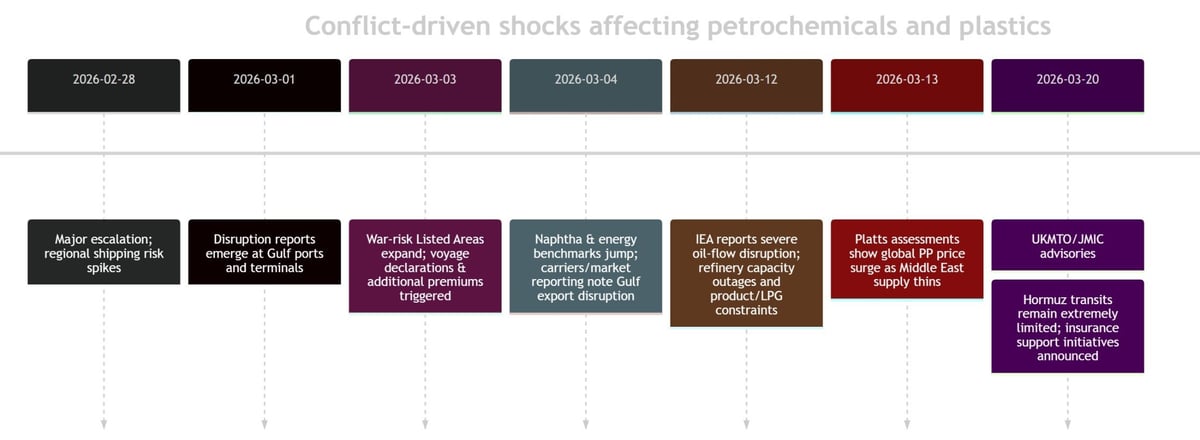
UK Maritime Trade Operations advisory reporting notes an historical average of ~138 vessels/day through Hormuz, with extremely limited "confirmed" commercial transits in the monitored period and a table showing low single-digit daily cargo vessel movements in mid-March.
International Energy Agency reports that oil flows via Hormuz were reduced to "a trickle," with large upstream production cuts and significant refining outages, implying immediate tightness in both fuels and petrochemical feedstocks.
The UKMTO advisory explicitly flags port/anchorage congestion compounded by electromagnetic interference and AIS/GNSS issues, increasing navigational hazards and raising effective dwell times for any ship willing to enter the region. For plastics, that means: fewer liftings of polymer cargoes, longer lead times, and higher demurrage/working-capital burdens for importers.
Virgin polymer prices respond to conflict through a stack of linked mechanisms that compound rather than substitute.
Polyolefins tied to ethane/propane/naphtha economics; PET tracks paraxylene (PX) and PTA economics plus energy. Sharp jumps in naphtha assessments and Dutch TTF gas raise marginal production costs.
Naphtha and LPG are petrochemical feedstocks. When refinery runs fall, shortage propagates into steam crackers, then monomers, then polymers with a lag measured in weeks.
Joint War Committee Listed Areas expansion triggers voyage declarations and "Additional Premium" negotiations. Even if resin is available at origin, "delivered price" depends on chartering and insurance.
Sanctions compliance risk can freeze trade finance, delay documentation, and force alternative payment/routing structures that add cost and time.
Where open reporting is available, assessed spot markets show similarly abrupt repricing—especially in polypropylene.
PP Injection CFR Far East Asia
+$330 since 2 MarPP Homopolymer FD NWE
+€220 since 1 MarPP Raffia CFR North Africa
+$190 WoWThe UKMTO/JMIC advisory shows cargo vessel transits through Hormuz collapsing to low single digits across multiple days in mid-March, compared with an historical average of ~138 vessels/day.
Fewer transits = reduced polymer and feedstock exports
Argus reports debris triggered a fire at one berth at Jebel Ali and notes disruptions at other regional ports. Jebel Ali handles a majority share of GCC polymer exports.
Alternative routing = smaller ports, longer inland hauls, higher costs
If Hormuz is effectively non-transitable for commercial operators, the export system must rely on partial bypass options, rerouting to non-Gulf terminals, or cross-basin swaps—none of which can fully substitute the normal system at short notice. UKMTO also flags elevated risk to ports and infrastructure beyond the immediate chokepoint, implying that simply "switching ports" is not frictionless.
Recycling offsets virgin disruption through three levers: molecule displacement, route diversification, and emissions reduction.
Every tonne of mechanically recycled polymer that meets specification is a tonne that does not need to be imported as virgin polymer through a war-risk chokepoint. The resilience benefit is also optionalität in procurement.
Life-cycle comparisons suggest substantial reductions in GWP for recycled pellets vs virgin pellets across common resins (PET, HDPE, PP). APR data shows recycled resin pathways having materially lower GWP than virgin.
Recycling changes logistics by moving cost from molecule procurement to collection, densification and sorting—often within tighter geographic radii. Buyer who can use certified recycled grades can reallocate spend toward local sources.
For PET, APR's model bale specification lists a bale density of 15–18 lb/ft³ (roughly 240–288 kg/m³), implying that moving one tonne of baled feedstock can require ~3.5–4.2 m³ before counting palletisation and void space. By contrast, pellets typically ship at much higher bulk density.
APR's bale specification is explicit that PVC contamination in PET bales is "not allowed" and can drive rejection—exactly the kind of fragility that becomes painful when buyers suddenly scramble for more rPET feedstock.
Even when recyclers have nameplate capacity, collection and sorting systems may not supply enough clean feedstock to run at high utilisation. Port congestion can affect both imported equipment/spares and the movement of bales/pellets.
Recycling investment depends on stable demand pull (recycled-content mandates, EPR, public procurement). The EU approach pairs recycled-content requirements (e.g., 25% recycled plastic in PET beverage bottles from 2025; 30% from 2030) with separate collection targets to increase feedstock availability.
In mid-March, ICIS reporting on the European rPET market notes that tighter virgin PET availability and higher PET prices were pushing demand back toward rPET flake, with the market explicitly warning against panic buying.
Key Insight: This is the classic "recycling as a buffer" dynamic—when virgin becomes scarce or unstable, qualified recycled volumes become a procurement hedge even if absolute prices also rise.
OPIS reporting describes strengthening rPET markets driven by rising upstream costs linked to the Middle East conflict, noting that higher vPET prices improved the relative competitiveness of recycled material.
Key Insight: The value of recycling is not always "cheaper price"—it is continuity and option value under disruption.
An illustrative structure for procurement and policy discussions combining logistics intensity, cost exposure, and emissions intensity.
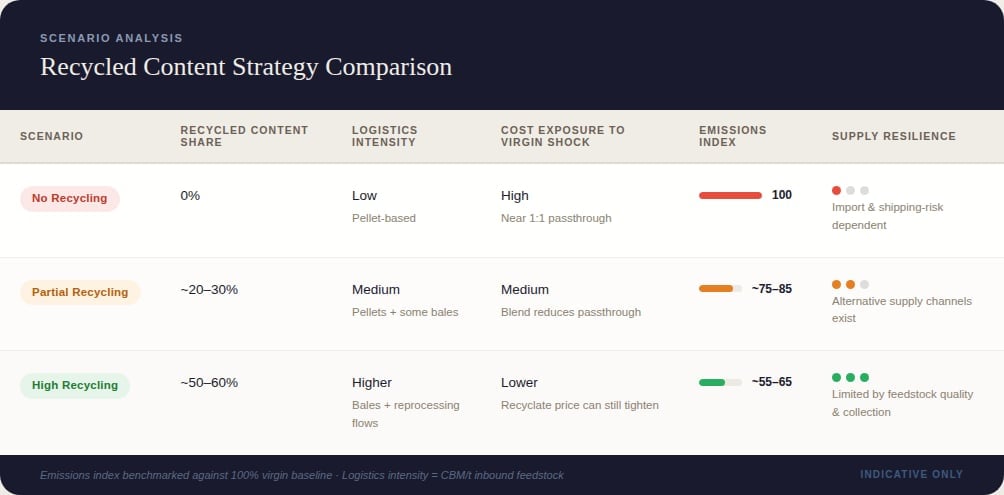
PET bales at 15–18 lb/ft³ imply ~3.5–4.2 m³ per tonne of baled feedstock, before accounting for handling constraints; pellet flows are typically more space-efficient.
A conflict shock is not the time to invent procurement policy from scratch. The winners tend to be those who already built optionality.
Uncertainty is not a footnote—it is the central pricing variable. Track the indicators below weekly (or daily during acute phases).
UKMTO/JMIC advisories; AIS-derived monitoring; threat level changes
Listed Areas updates; additional premium negotiations; market capacity signals
Naphtha and gas price moves that directly shift cracker economics
Futures-linked indicators (PP/LLDPE/PVC/PET); assessed spot markets (Platts/ICIS/Argus)
Jebel Ali and alternative ports operability; spillover risk beyond chokepoints
Bale price inflation; contamination/rejection rates; rPET demand drivers
Back to Publications
View All PublicationsA global initiative dedicated to sustainable recycling practices and environmental stewardship.
© 2026 Recyclers Alliance. All rights reserved.